3. SPECGRAM and SPECGRAMDEMO
The specgram
and specgramdemo function in Matlab
makes a Time-dependent frequency analysis.
The specgramdemo function is a
user friendly interface to make easier and significant the data provided by the
specgram function. First we concentrate the efforts
in the understanding of the specgram function and
then we will see how the specgramdemo improves the
results of the specgram function.
The
specgram function do the STFT of a signal of finite
time acquired at a specific sampling rate.
The
parameters for the specgram function are described
below:
INPUT
PARAMETERS:
Any
application of the specgram requires a vector,
other values could be specified, if not are specified Matlab will take the default value.
specgram(a,nfft,fs,window,numoverlap)
a : Correspond to the vector
of the input signal.
nfft :
Specify the size of the FFT that specgram uses.
default:
nfft = min(256,length(a)).
fs :
Is the sampling frequency of the vector a.
default:
fs=2.
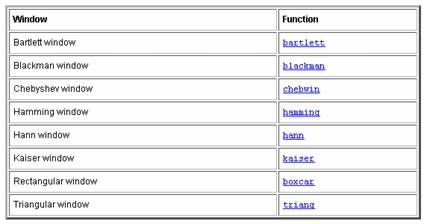
window : This is the kind of windowing
function that will be in the nfft space in
the a vector.
You must care that: length(window)<nfft.
default: periodic Hann (Hanning) window of length nfft.
You can use one of the following windows
provided for matlab:
numoverlap : It defines
how much the new window overlap the one before.
default: numoverlap = length(window)/2.
You must care that numoverlap< length(window).
Graphically
each of the values mentioned above are:

![]()
Following
to this, each segment of the vector a, is zero
padded and the FFT is calculated:

OUTPUT
VALUES:
The
FFT of each segment is stored in one column vector that is join to make the matrix
B that correspond to the output of the specgram
function.
Another
outputs provided by the specgram function are the
column vectors t and f.
The
vector t contains the time at each of
the windows starts. A way to calculate the number of rows of this vector is (is
the same number of columns of B):

where n
is the length of the vector a.
Observation: Note that the k number doesn’t depends
of the nfft number this is because the nfft affects the frequency resolution of the window that
I’m observing. Be aware that the length(window)≤nfft. This is because a the fft
returns a vector (of length nfft) equal to the sum of
length(window) and the zeropadding
that we must do.
The
vector f contains the frequencies at
which the FFT is calculated. The length of this vector is the nfft specified in the input parameters.
Observation: This vector depends of the nfft value. If you increase the nfft
value the vector f will be longer. The ratio between nfft
and the length(f) is the double.
|
|
f1 |
|
|
|
|
|
|
|
|
|
|
|
|
|
|
|
|
|
|
f3 |
|
|
|
|
|
|
|
|
|
|
|
|
|
|
|
|
|
|
f2 |
|
|
|
|
|
|
|
|
|
|
|
|
|
|
|
|
|
|
|
|
|
|
|
|
|
|
|
|
|
|
|
|
|
|
|
|
f |
|
|
|
|
|
|
|
|
|
|
|
|
|
|
|
|
|
|
|
|
|
|
|
|
|
|
|
|
|
|
|
|
|
|
|
|
|
v |
|
|
|
|
|
|
|
|
|
|
|
|
|
|
|
|
|
|
e |
|
|
|
|
|
|
|
|
|
|
|
|
|
|
|
|
|
|
c |
|
|
|
|
|
|
|
|
B |
|
|
|
|
|
|
|
|
|
t |
|
|
|
|
|
|
M |
A |
T |
R |
I |
X |
|
|
|
|
|
|
o |
|
|
|
|
|
|
|
|
|
|
|
|
|
|
|
|
|
|
r |
|
|
|
|
|
|
|
|
|
|
|
|
|
|
|
|
|
|
|
|
|
|
|
|
|
|
|
|
|
|
|
|
|
|
|
|
|
|
|
|
|
|
|
|
|
|
|
|
|
|
|
|
|
|
|
|
|
|
|
|
|
|
|
|
|
|
|
|
|
|
|
|
|
|
|
|
|
|
|
|
|
|
|
|
|
|
|
|
|
|
|
|
|
|
|
|
|
|
|
|
|
|
|
|
|
|
|
|
|
|
|
|
|
|
fnfft |
|
|
|
|
|
|
|
|
|
|
|
|
|
|
|
|
|
|
|
|
|
|
|
|
|
|
|
|
|
|
|
|
|
|
|
|
|
|
|
t1 |
t2 |
t3 |
|
|
|
|
|
|
|
|
|
|
|
tk |
|
|
|
|
|
|
|
|
t |
|
v |
e |
c |
t |
o |
r |
|
|
|
Each
column of the vector B contains the FFT of each product window-signal.
Here
there are some examples of syntax:
specgram(a) This
makes the specgram of a with default values.
nfft=min(256,length(a)).
fs=2.
window=hann(nfft).
numoverlap= length(window)/2.
B
= specgram(a) This
assigns the ouput of the specgram
to the matrix B.
nfft=min(256,length(a)).
B = specgram(a,nfft) This makes a specgram at specified value nfft.
If nfft=256 then is equal to the one before.
[B,f] = specgram(a,nfft,fs) Here the
frequency output vector is returned.
And
the Sampling frequency is specified.
[B,f,t] = specgram(a,nfft,fs) Here the time
vector is returned.
B
= specgram(a,nfft,fs,window) Here
a window is specified.
B
= specgram(a,nfft,fs,window,numoverlap) Here an overlap is specified.
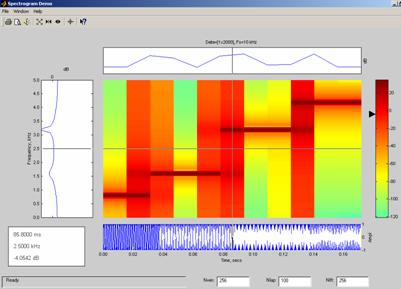
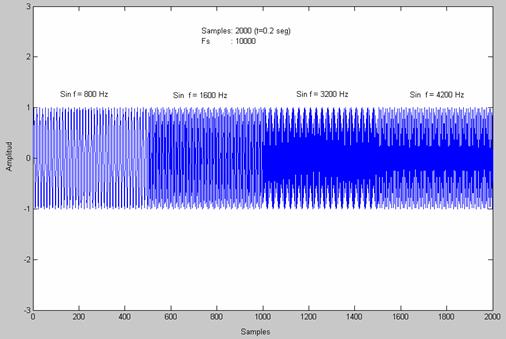
Example:
With
the next signal as vector a (#samples=2000 , fs=1000):
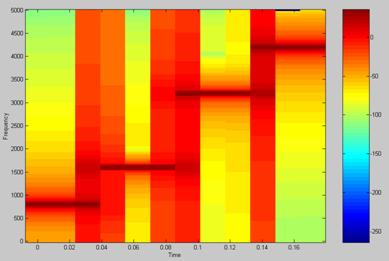
Then
with the next command:
>>
specgram(output,256,10000,hann(256),100),colormap(jet),colorbar;
The
output is:
![]()
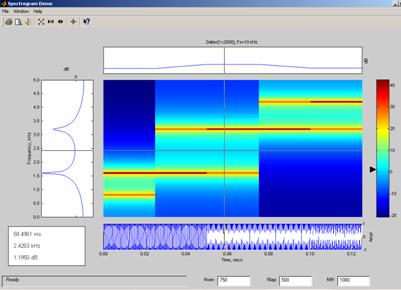
Another
example with the same signal:
>> specgram(output,1000,10000,hann(750),500),colormap(jet),colorbar;
The
output is:
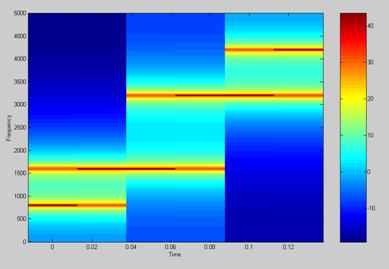
![]()
As we can see the second graph has less k for this reason appear fewer segments over the time axis. In the second graph the horizontal lines looks thinner it means higher spectral resolution; this is because the nfft value of the second graph is 1000 instead of 256.
The specgramdemo is basically a user friendly version of the specgram function. On this function you have to specify two things the time sequence and the fs (sampling frequency).
You must write on the command line of Matlab the following:
>>specgramdemo(a,fs);
The tool will work with default values. Here there are the two graphs of the examples given before.