Computer Homework
done on Matlab
Description
:
We will use Matlab for many homework problems. So that all homework has the same format, please use the following guidelines:
1. All matlab homework will be printed. This includes the program listing and the output.
2. Programs should start with a short description. This should include:
- a. What the program does.
- b. What input the program needs (if any).
- c. What the output is.
In describing the output, include the figures that are presented. Example:
- % Description:
% The following program simulates a single sideband AM
modulator and demodulator.
% It synthesizes a cosine with a frequency of 10 Hz, and modulates this signal
with a
% carrier of 100 Hz. It then recovers the original signal using a 5th order
Butterworth LPF
% with a cutoff frequency of 15Hz.
% Input:
% The program needs no input to run.
%Output:
% The program produces 6 graphs as output;
% 1. a graph of the original signal before modulation,
in time.
% 2. a graph of the original signal in frequency.
% 3. a graph of the SSB modulated signal in time.
% 4. a graph of the SSB modulated signal in frequency.
% 5. a graph of the demodulated signal in time.
% 6. a graph of the demodulated signal in frequency.
3. The name of the program
file should be hw*.m, where
* is the homework number. For example, for homework 2, the file should be
called hw2.m. If the homework has more than one part, these should be separated
by comments, but in the same program. The program description should be at the
beginning of the program, not the beginning of the section.
4. All programs should have clear as the first command.
5. Graphs must have a title and a label for each axis.
6. Place a pause command after each graph.
7. Choose the x and y axes so that the information is presented in a way that
is clear and easy to understand. If the x or y axis is too small or too large,
it will be difficult to determine what is being presented. In the graphs below,
a cosine with a frequency of 1Hz is shown with an x axis of 100 seconds in
figure 1, then with an x axis of 0.5 second sin figure 2, and finally with an x
axis of 3seconds in figure 3. As you can see the in the first two graphs, it is
not clear that a cosine is being presented. Figure 3 clearly shows a cosine
function. Unfortunately there are no rules that work for all cases, since the x
and y axes depend on the figure being presented. This means that it is up to
you to determine the best way for selecting the axes, and to select appropriate
axes sizes.
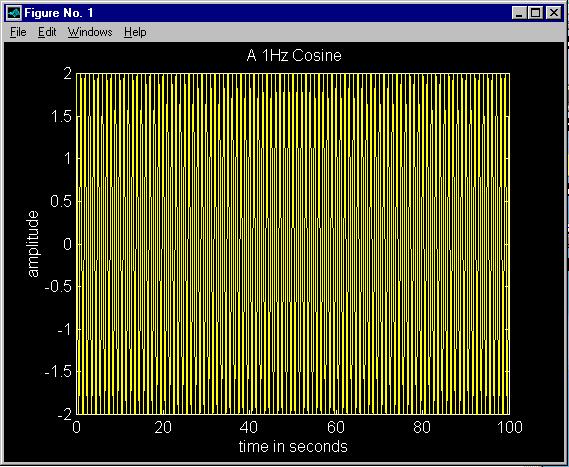
Figure 1
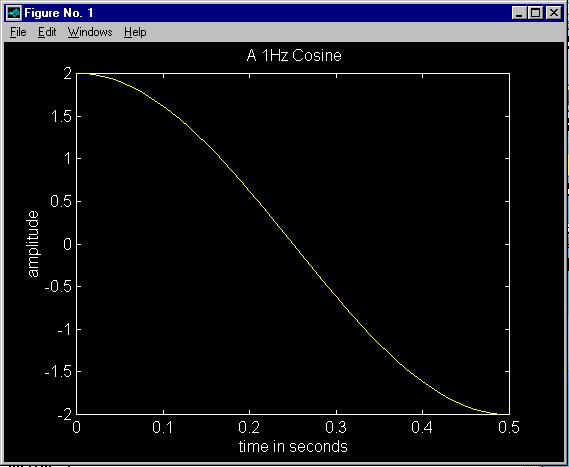
Figure 2
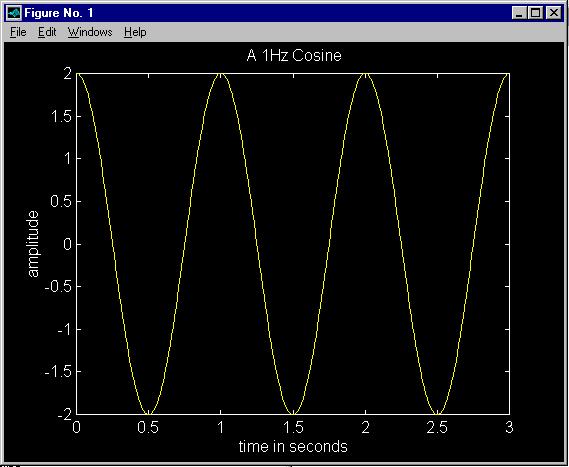
Figure 3
8. Save the results in a .mat
file and include this in the work handed in.
9. Do not make the program
interactive. Leave this for more advanced courses. I want to see your results.
This means you show the graphs as desired, and all the variables are defined by
you.