ICOM 5995
Performance Instrumentation and
Visualization for High Performance Computer Systems
Department of Electrical & Computer Engineering
University of Puerto Rico – Mayaguez
Fall 2002
Lecture 4: September 25, 2002
Evaluate outcome of homework 3: evaluating Amadeus/LAM MPI using NPB.
Topics:
Overview of parallel and distributed systems
Software Environments
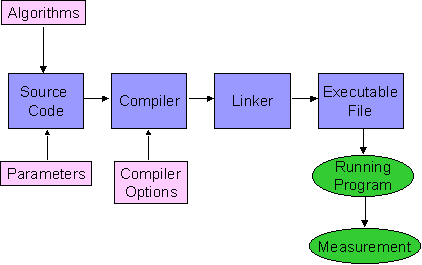
Mapping Process

What software tools are used for mapping algorithms to HPC systems?
- Compilers
- Operating Systems
- Debuggers
- Job Schedulers
- Profilers
- Instrumentation software
- Visualization software.
Programming Languages:
Fortran
C/C++
Java
Others
Libraries
MPI: Message Passing Interface
OpenMP:
High Performance Fortran (HPF)
Others (eg. PVM).
Terminology of Parallelism
Task
A logically discrete section of computational work.
Parallel Tasks
Tasks whose computations are independent of each other, so that all such tasks can be performed simultaneously with correct results.
Serial Execution
Execution of a program sequentially, one statement at a time.
Parallelizable Problem
A problem that can be divided into parallel tasks. This may require changes in the code and/or the underlying algorithm.
Example of Parallelizable Problem:
Calculate the potential energy for each of several thousand independent conformations of a molecule; when done, find the minimum energy conformation
Example of Non-parallelizable Problem:
Calculation of the Fibonacci series (1,1,2,3,5,8,13,21,...) by use of the formula: F(k + 2) = F(k + 1) + F(k)
Types of Parallelism
Two basic types:
Data parallelism: each processor performs same task, but on different data.
Example: Searching census data
Functional parallelism: different tasks on different processors.
Example: Ecosystem model, with each processor representing different level of food chain
Observed Speedup
Observed speedup of a code which has been parallelized =
wall-clock time of serial execution
--------------------------------------
wall-clock time of parallel execution
Synchronization
The temporal coordination of parallel tasks. It involves waiting until two or more tasks reach a specified point (a sync point) before continuing any of the tasks.
· Needed to coordinate information exchange among tasks.
· Ex: parallelizable problem above
· Can consume wall-clock time because tasks(s) sit idle waiting for other tasks to complete
· Can be a major factor in decreasing parallel speedup
Parallel Overhead
The amount of time required to coordinate parallel tasks, as opposed to do useful work.
Examples:
· Time to start a task
· Time to terminate a task
· Synchronization time
Granularity
A measure of the ratio of the amount of computation done in a parallel task to the amount of communication.
Finer granularity ==> more synchronization ==> less speedup
Massively parallel system
A parallel system with many processors. "Many" is usually defined as 1000 or more processors.
Scalable parallel system
A parallel system to which the addition of more processors will yield a proportionate increase in parallel speedup. Some factors:
· Hardware
· Algorithm you use for parallelization
· How well you code the algorithm
Taxonomy of Parallel Programming Tools
Taken from: Appelbe B. and D. Bergmark, “Software Tools for High Performance Computing: Survey and Recommendations”, Scientific Programming, Volume 5, No. 4, Fall 1996.
Compilers:
For Fortran, C/C++, Java. The input may be ether sequential or parallel.
Example: KAP/PRO, PGI Workstation (PGI's parallelizing F77, F90, HPF, C and C++ compilers and development tools. Includes the OpenMP parallel debugger/profiler).
Program Restructurers and Parallelizers
Convert sequential or partially parallel programs into efficient parallel programs. Transforms source code into source code (not executable or object code like compilers).
Example: ParaWise (the Computer Aided Parallelization Toolkit (previously known as CAPTools) takes a serial FORTRAN 77 code and automatically generates: Message Passing Parallel FORTRAN 77 code, shared Memory directive code using OpenMP, or a hybrid of Message Passing and OpenMP.)
Parallel Debuggers
Extend traditional debuggers with the ability to control and monitor execution of individual tasks. Parallel debuggers should be capable of detecting parallel errors at runtime, such as race conditions.
Example: TotalView. Parallel debugger for MPI
Execution and Performance Analyzer
Execution analyzers tell the user what happened during the execution of a program. They are post mortem. Performance analyzers determine resources bottleneck, and may suggest source code modifications to remove these. Performance analyzers can include tools to automatically instrument programs to gather trace data for later analysis.
Example: TAU. TAU (Tuning and Analysis Utilities) is a visual programming and performance analysis environment for parallel C++, Java, C, Fortran 90, HPF, and HPC++. The TAU tools are implemented as graphical hypertools. While they are distinct tools, they act in concert as if they were a single application.
Libraries
Canned parallel libraries and packages can greatly reduce development effort
Example: BLAS (Basic Linear Algebra Subprograms). The BLAS (Basic Linear Algebra Subprograms) are high quality "building block" routines for performing basic vector and matrix operations.