The following images are graphics and figures of data obtained on the research and projects. There are also photos of some of the instruments used on the research.
*Click on the images to see an enlarged version.
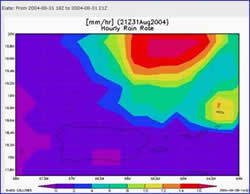 |
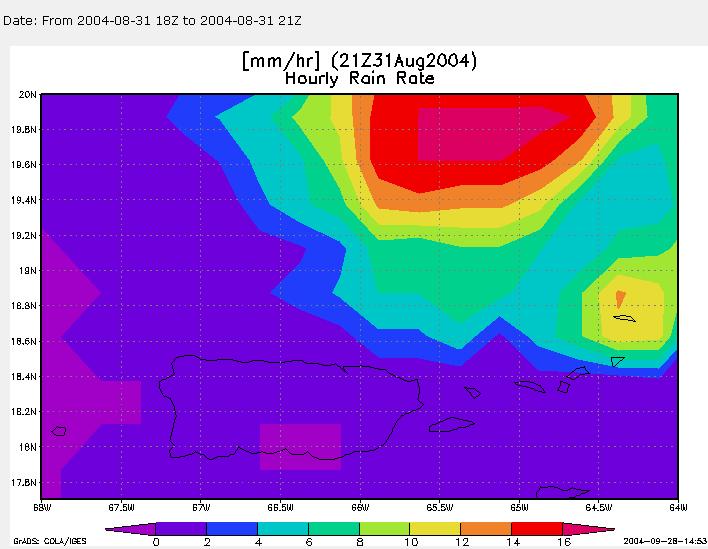
NASA TRMM data from Hurricane Frances when passing close to San Juan, PR, 10 miles North, causing rainfall detected by the rain gauges and disdrometer.
Graduate students Margarita Baquero and José Maeso; NASA TCESS, and NSF CASA projects under supervision of Dr. Sandra Cruz-Pol. |
 |
Hurricane Frances pass over Puerto Rico - Comparison charts with rainfall data from the disdrometer and the ASOS SJU airport rain gauge are shown.
Graduate students Margarita Baquero and José Maeso; NASA TCESS, and NSF CASA projects under supervision of Dr. Sandra Cruz-Pol. |
 |
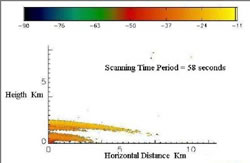
Cirrus cloud image seen by 33GHz radar and trace of airplane with NCAR ice crystal sampler.
NASA FAR and NASA TCESS projects , graduate students Jose Morales and Jorge Trabal. |
|
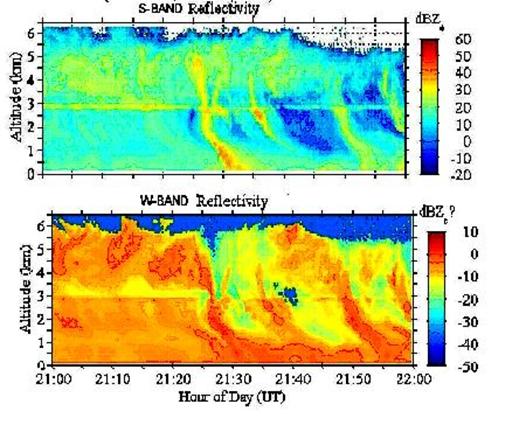
Active rain gauge concept is developed from data measuring a precipitation event at two radar frequencies, 2.8 GHZ and 95 GHz. Themelting layer can be observed at around 3km of height.
NASA FAR and NASA TCESS projects performed by graduate student Leyda León, under supervision of Dr. Sandra Cruz-Pol. |
|
The plot depicts the radar reflectivity scanning measured at 33GHz (Ka band) with CPRS of a cumulonimbus cloud.
Graduate student Jorge Villa, Under the supervision of Dr. Sandra Cruz-Pol, NASA FAR and NASA TCESS. |
|
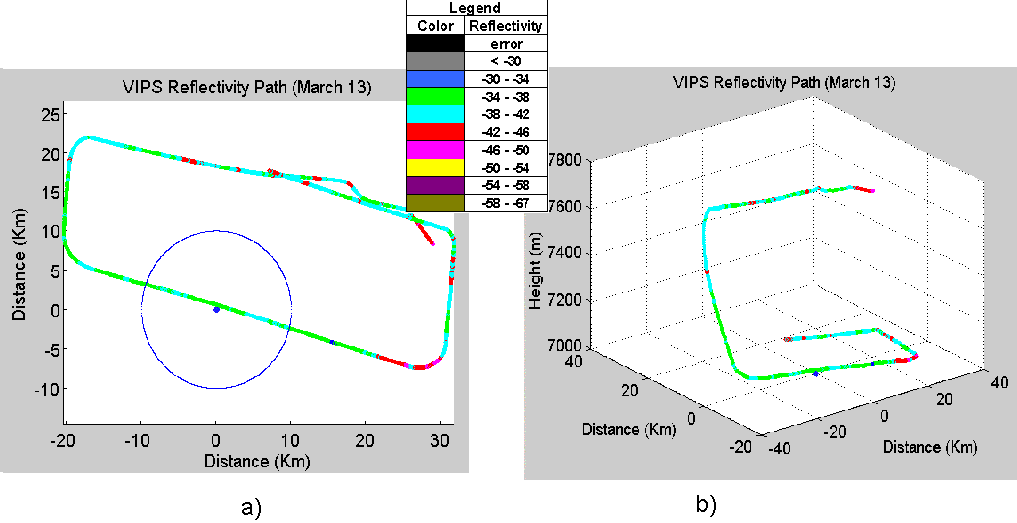
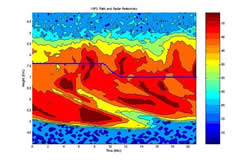
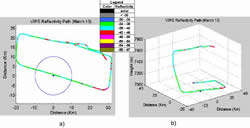
a) Overhead view of the VIPS flight track pattern for March 13, 2000. The blue dot at (0,0) indicates the position of the CPRS radar, the blue circle is only a reference for data that were spatially closed between sensors. b) Is the same as (a) but in 3D to show the altitude variation.
Performed by graduate students José Morales and Jorge Trabal under supervision of Dr. Sandra Cruz-Pol. |
|
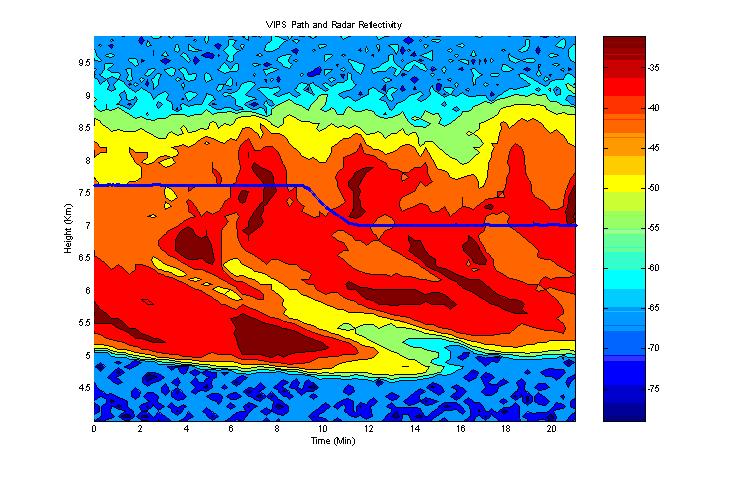
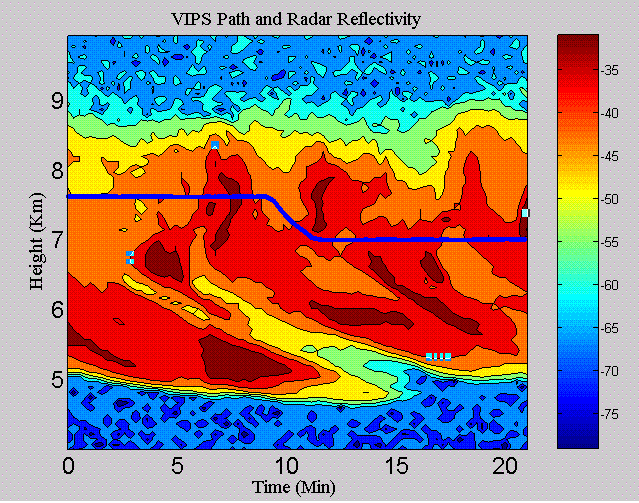
CPRS reflectivity plot versus time showing the trajectory of the airplane through the cirrus cloud.
NASA FAR project, graduate students José Morales and Jorge Trabal under supervision of Dr. Sandra Cruz-Pol. |
|
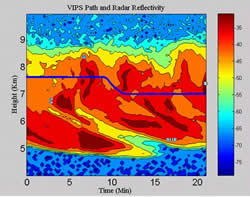
Plot showing on the left scale the radar reflectivity from the CPRS and the computed reflectivity from the VIPS particle size distribution and on the right the distance between the radar and the airplane position. Obviously the best agreement occurs at the center of the graph where the distance is a minimum.
NASA FAR project, graduate student José Morales under supervision of Dr. Sandra Cruz-Pol. |

|
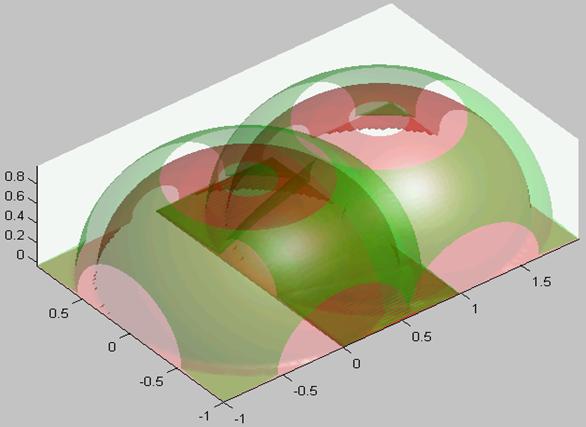
Two Radars coverage areas (hemispheres) for overlapping coverage; two ranges are shown for each radar.
Ph.D. student Leonid Tolstoy under supervision of Dr. Sandra Cruz-Pol, NSF CASA. |
|
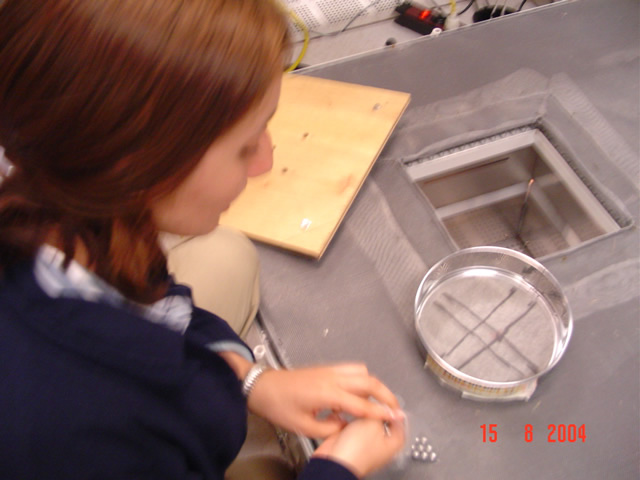
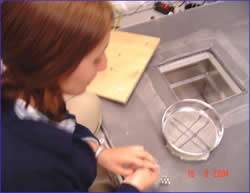
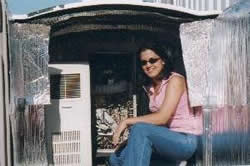
Graduate student Margarita Baquero performing calibration of 2D video disdrometer.
CASA project in collaboration with CSU and the San Juan NWS. |
|
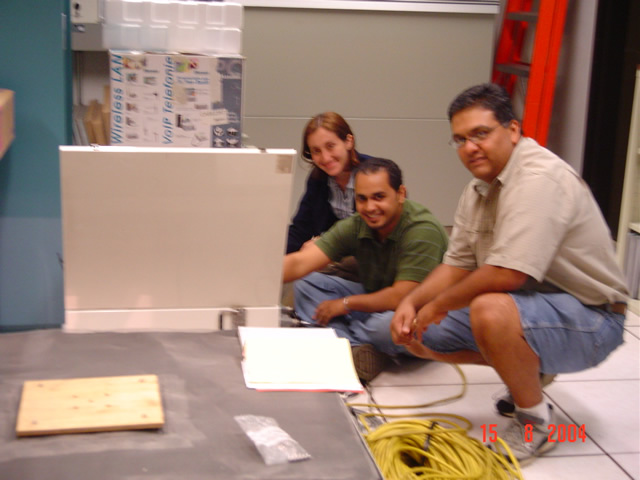
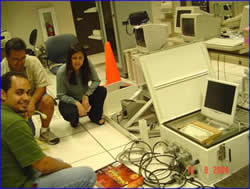
Dr. Sandra Cruz-Pol ( right), Margarita Baquero, José Maeso & Miguel Gálvez setup 2DVD indoors.
CASA project in collaboration with CSU and the San Juan NWS. |
 |
Graduate student Margarita Baquero, and José Maeso and undergraduate CSU student Miguel Gálvez performed Initial Plane Test.
CASA project in collaboration with CSU and the San Juan NWS |
 |
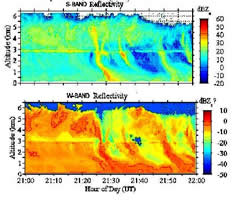
Graduate student Leyda León, operating an S-band profiler and a W band radar to study rain.
NASA TCESS and NASA FAR projects, under supervision of Dr. Sandra Cruz-Pol in collaboration with UMass, Dr. Steve Sekelsky. |
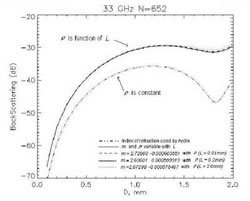 |
Images from the presentation: "Modeling, Simulation and Comparison Study of Cirrus Clouds' Ice Crystals." |
 |
Images from the presentation: "Non-Precipitating Stratus Cloud Characterization Using a Ground-based Microwave Doppler Radar." |